The building
Photographed on site, not lifted from a brochure.
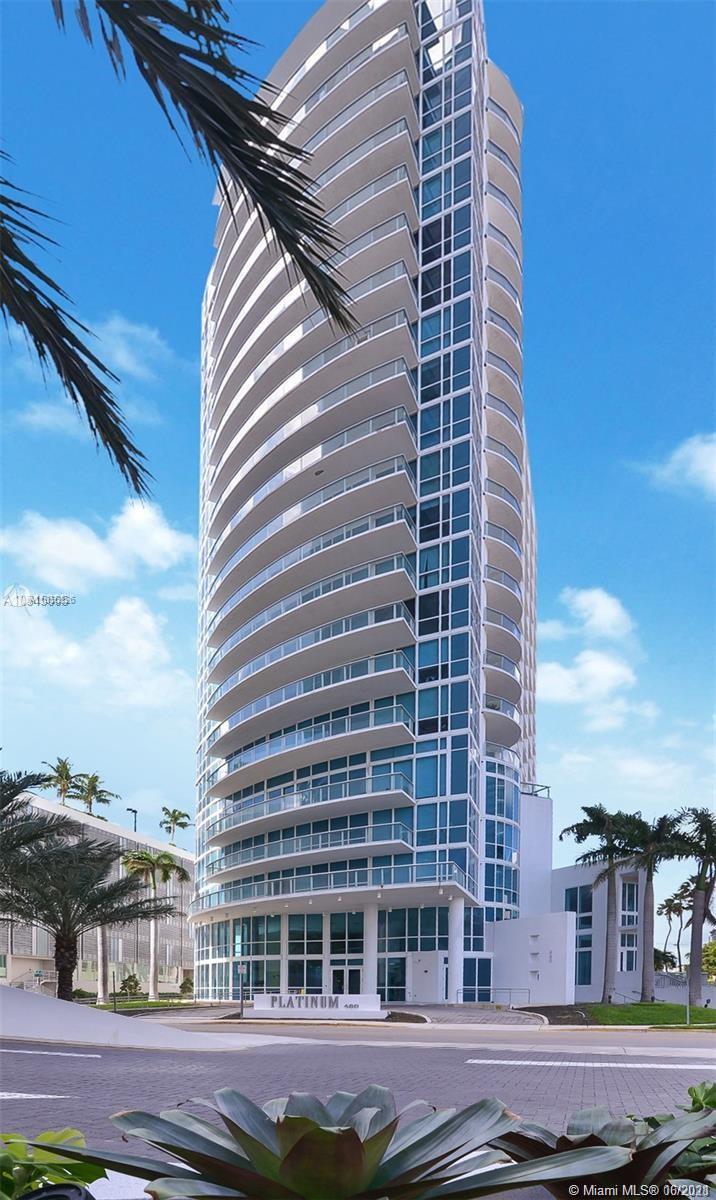
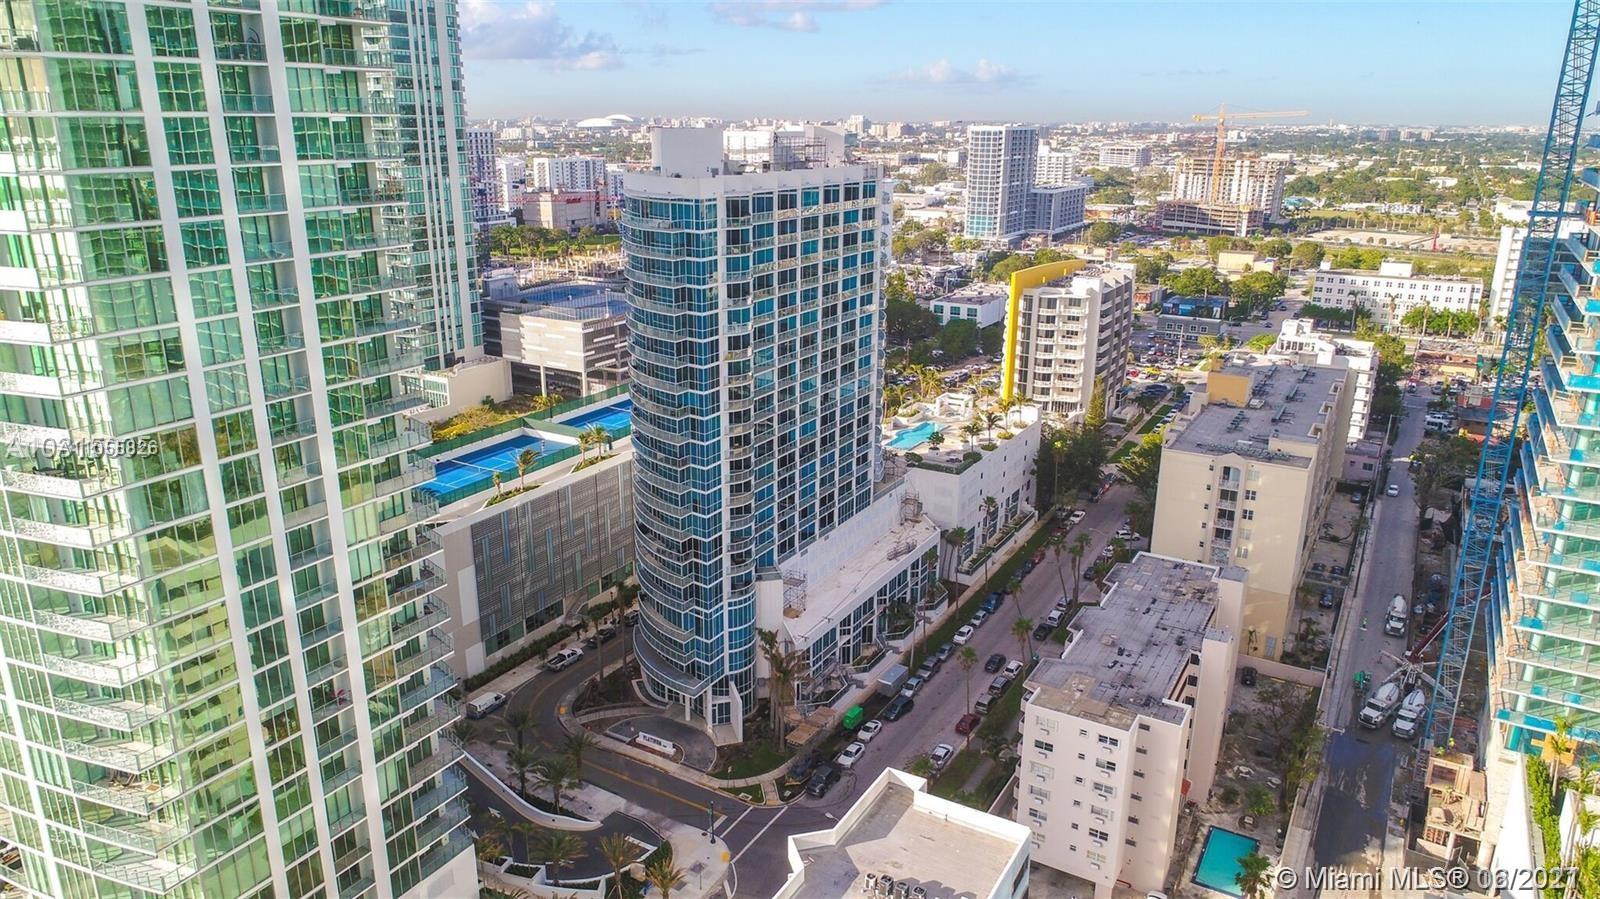
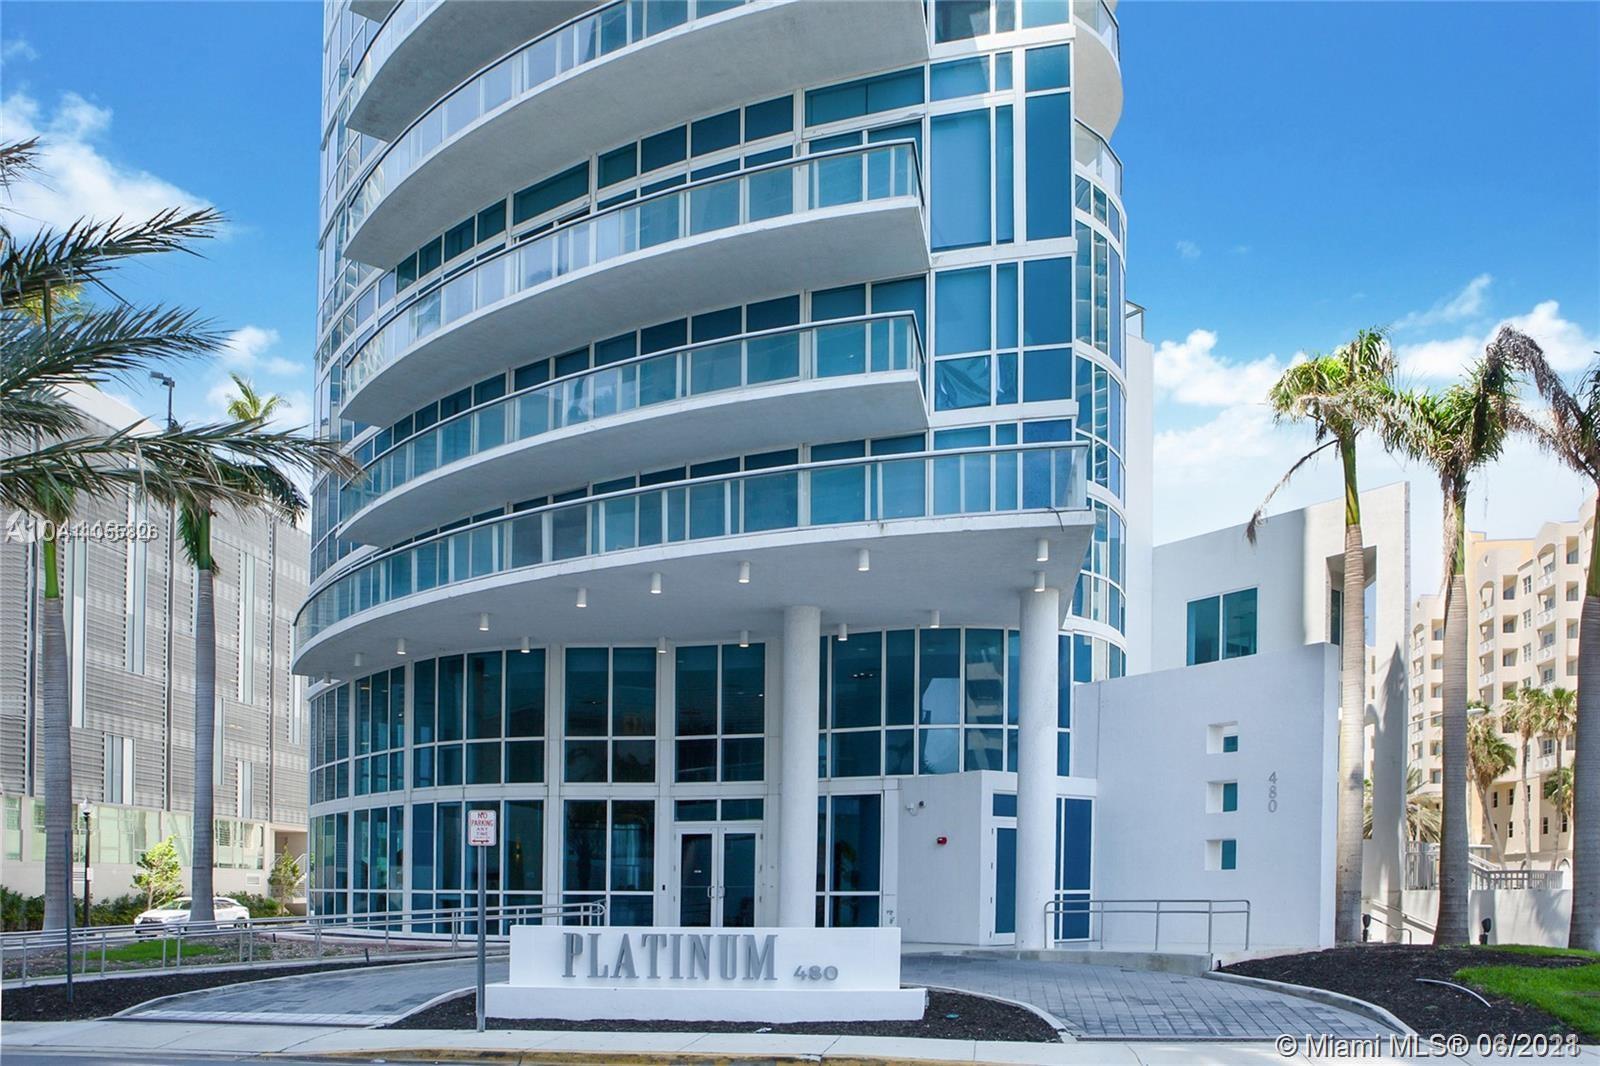
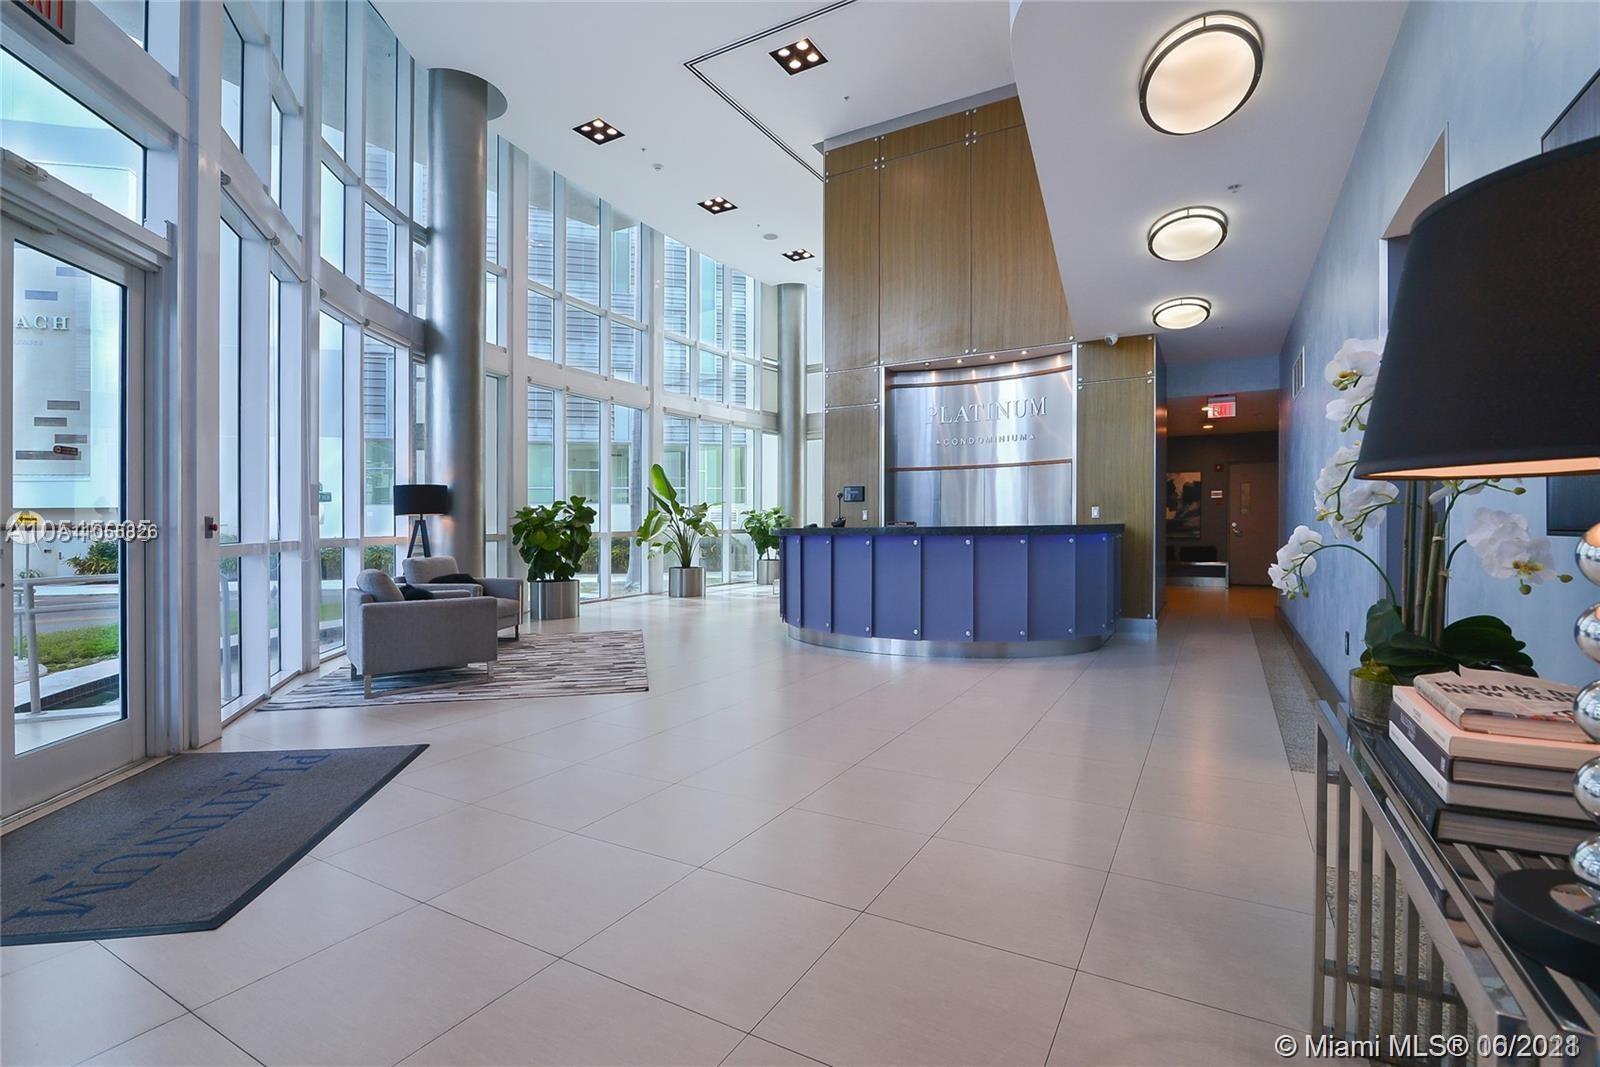
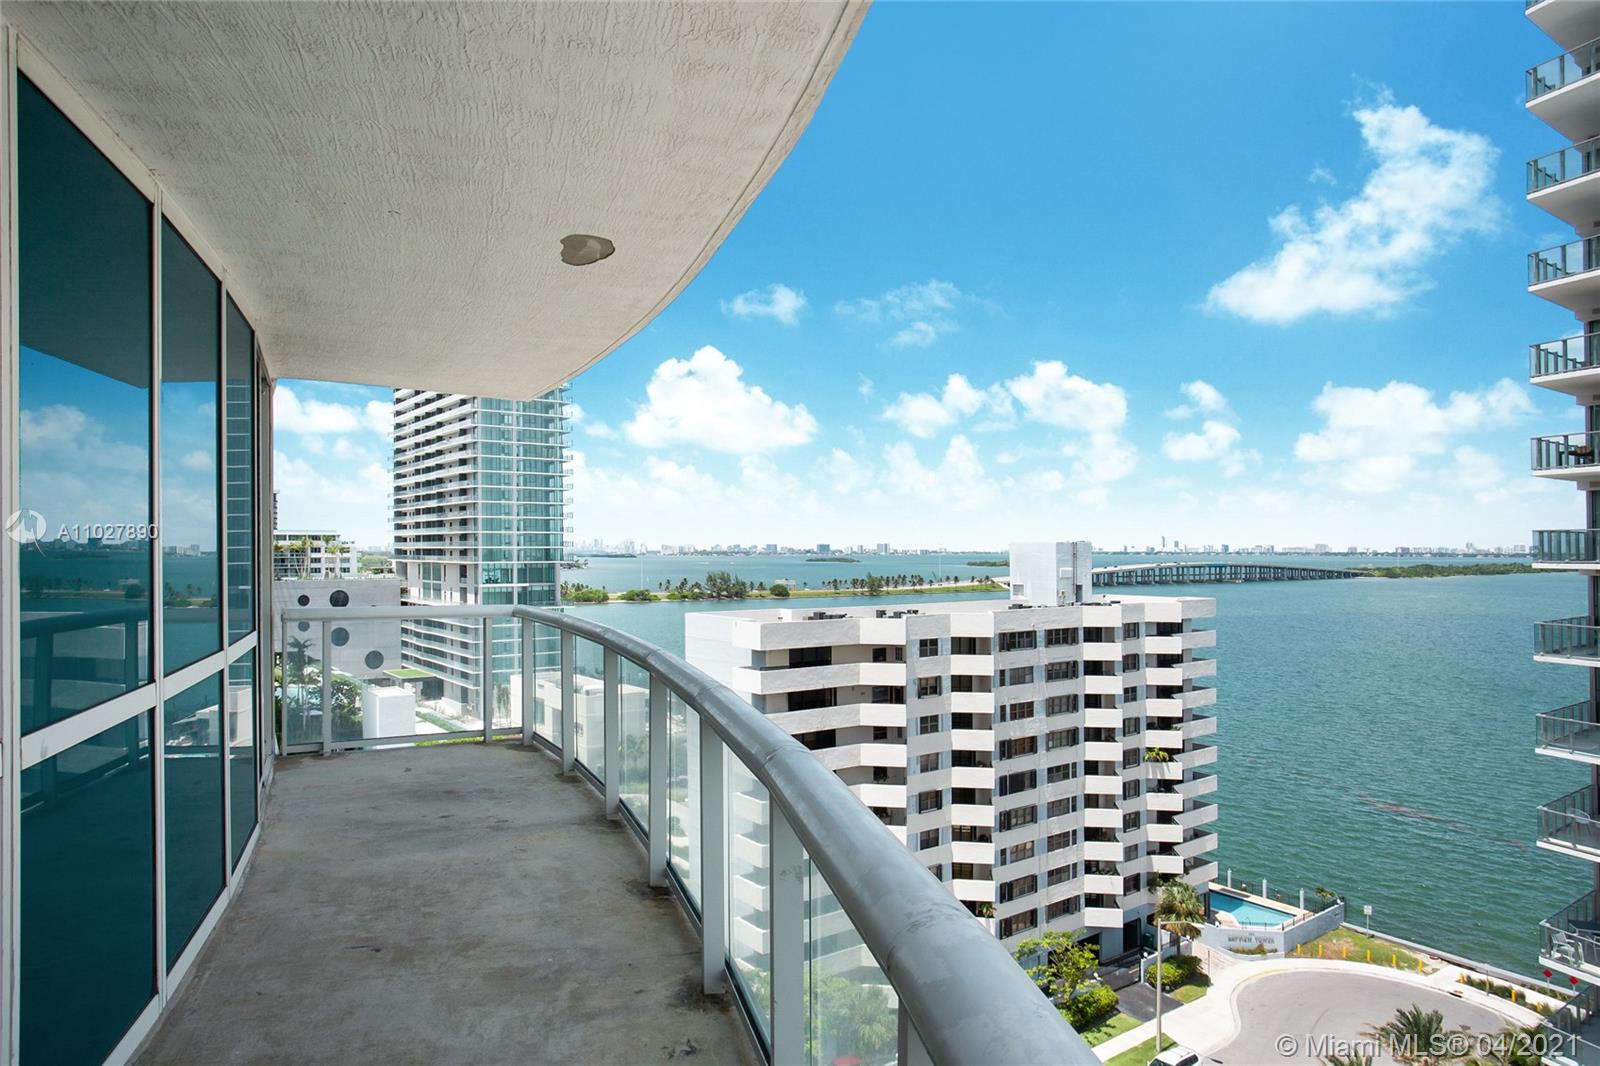
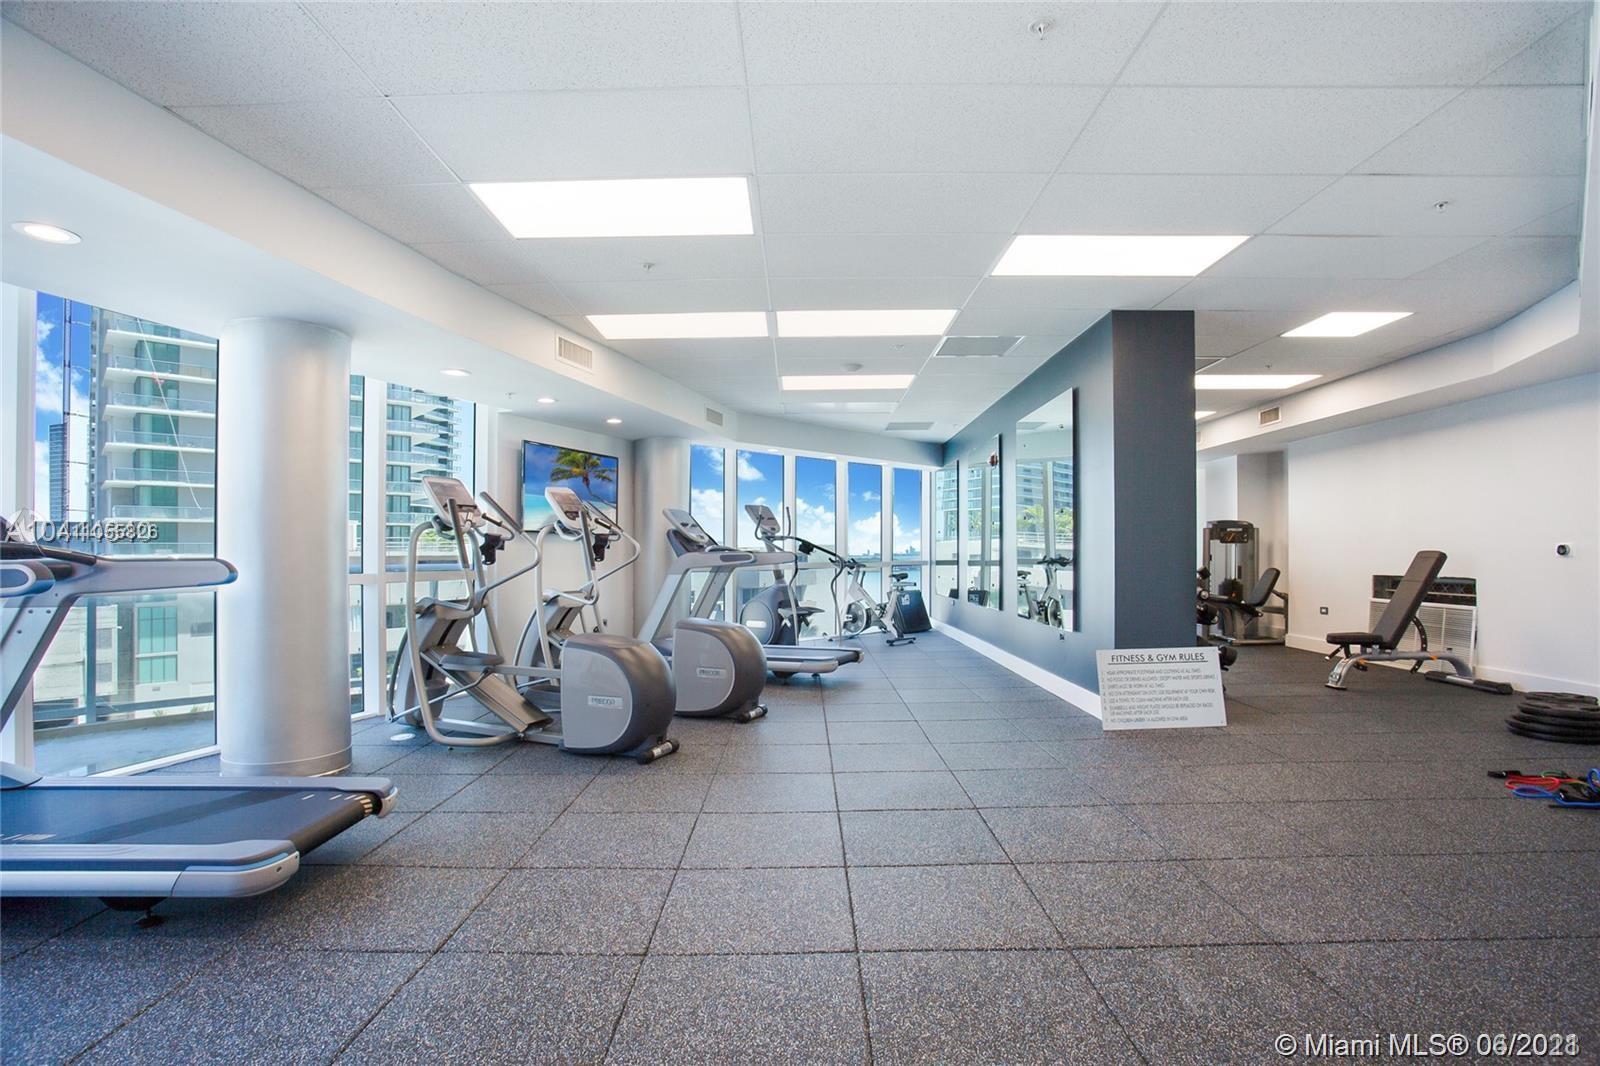
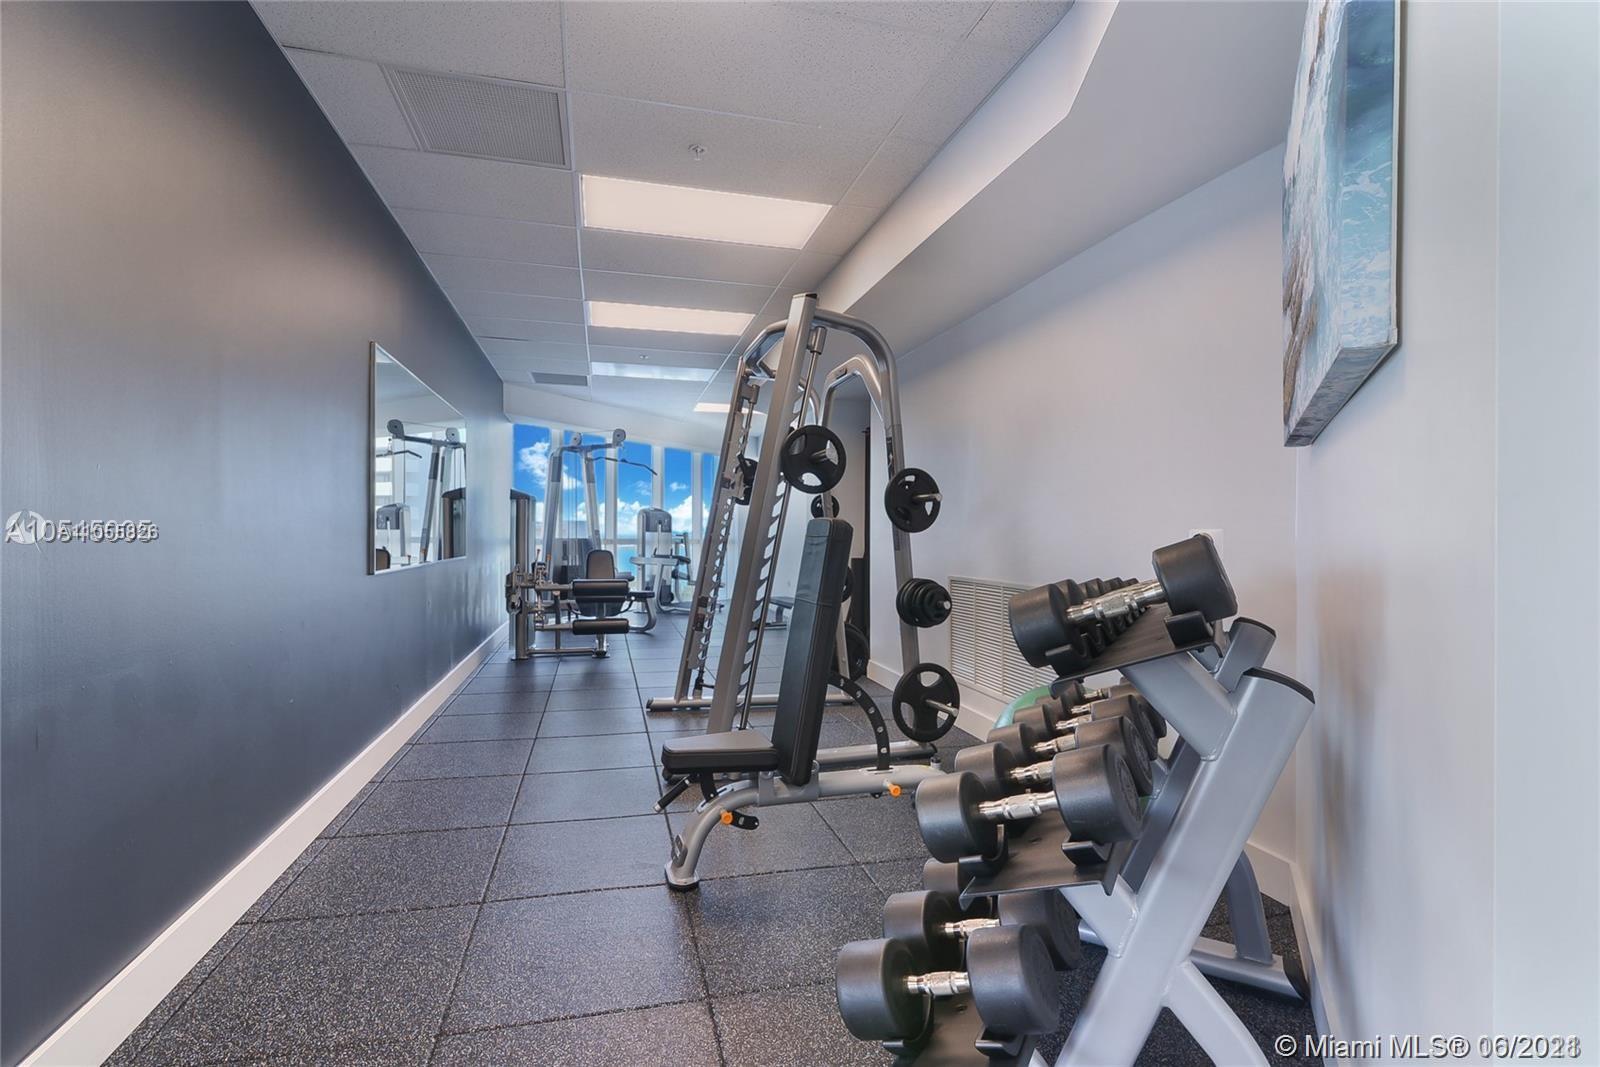
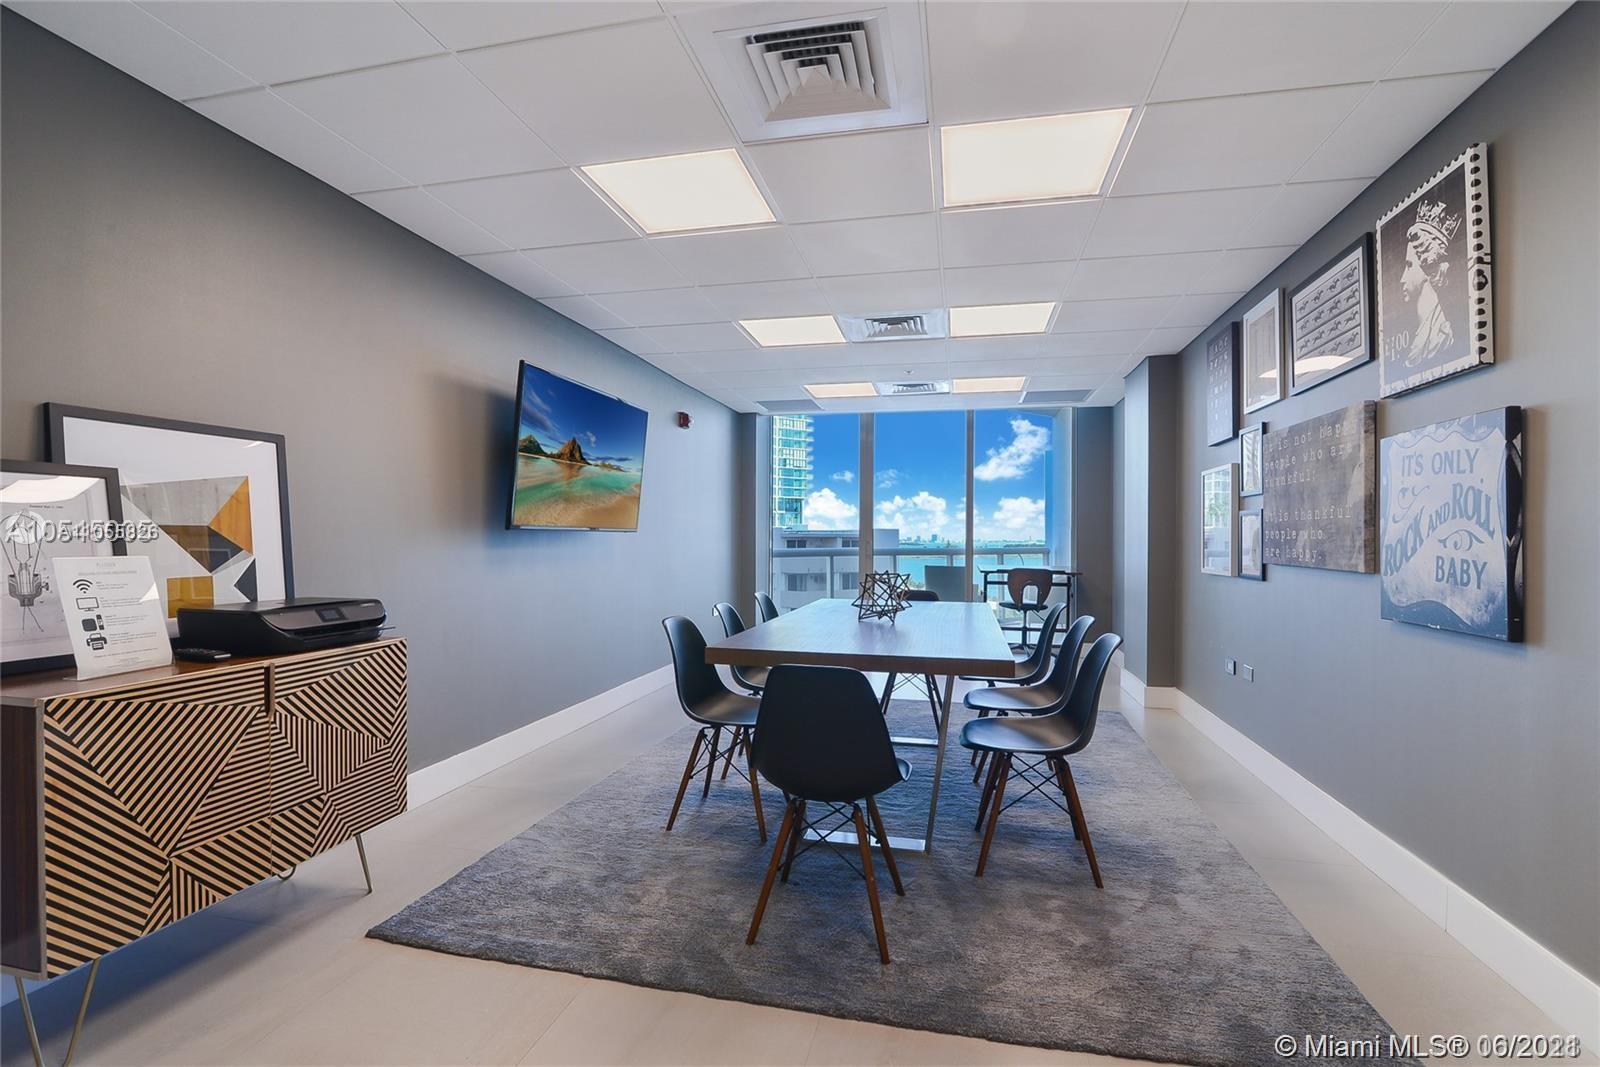
Edgewater · Miami
480 NE 30th St. A 2006 condominium in Edgewater, and one of the few buildings at this price where the rent actually covers the carry. This page is the evidence: what units close at, what they lease for, and the net yield once HOA, tax and insurance come out. Every figure is a recorded MLS transaction, not a projection.
Live active listings at 480 NE 30th St, lowest price first. Pulled from the MLS when this page loaded.
The evidence
Two records, side by side, both from recorded MLS transactions in this building. A building where these two numbers line up is an income asset. A building where they do not is a place to live. Platinum is the first kind.
The 1,007 sf two-bedroom is the most traded plan in the building, on both sides of the ledger, so it is the one worth doing the arithmetic on. Four of the seven recent closings and nine of the eighteen leases are this plan.
| Purchase, median of 4 recorded closings on this plan | $493,500 |
| Annual rent, median lease $3,500/mo × 12 | $42,000 |
| HOA, $1,052 a month | −$12,624 |
| Property tax at 2.02% | −$9,969 |
| Insurance (HO-6) at $3.60/sf | −$3,625 |
| Net operating income | $15,782 |
| Net yield on the purchase price | 3.2% |
What this does not include: vacancy, turnover, management and any special assessment. Assume one month of vacancy between tenants and the net falls to 2.5%. Gross yield is 8.5%, which is the number most listings quote; the 3.2% is what actually reaches you, and it is a genuinely good figure for Miami condominium stock at this price.
Not a curated sample. This is the complete sale record for the building over two years, which is thin enough that you should read the individual rows rather than lean on the median.
| Unit | Closed | Beds/Baths | Sq ft | Close price | $/sq ft |
|---|---|---|---|---|---|
| #1103 | Dec 2025 | 2/2 | 1,007 | $497,000 | $494 |
| #1505 | Nov 2025 | 2/2 | 1,007 | $470,000 | $467 |
| #1405 | Aug 2025 | 2/2 | 1,007 | $550,000 | $546 |
| #1803 | Jul 2025 | 2/2 | 1,007 | $490,000 | $487 |
| #2104 | Jun 2025 | 1/2 | 828 | $425,000 | $513 |
| #802 | Apr 2025 | 1/2 | 828 | $400,000 | $483 |
| #104 | Aug 2024 | 1/2 | 1,287 | $704,000 | $547 |
Eighteen leases in twelve months is real liquidity on the rental side, and the median $3,450 against a $494/sf purchase is what produces the 3.2% net. Most Miami condominium stock at this price does not clear 2%.
Seven closings in two years, and the spread runs $467 to $547/sf on effectively the same two-bedroom plan. That is a 17% gap between the best and worst execution, which is negotiating room rather than noise. The row you buy at matters more than the median.
A 2006 building in Florida is inside the window where structural reserve funding and milestone inspections drive assessments. The HOA figure above is today's, not tomorrow's. I pull the reserve study and the last two years of minutes before you sign anything.
Photographed on site, not lifted from a brochure.
BlueBay Brokers
I am Steve Gabison, a Florida broker, licence BK3411036. I wrote this page from recorded transactions and I will send you what is behind it.
Every closing and every lease unit by unit, the reserve study and the last two years of HOA minutes, and a rental underwriting on the specific line you are considering. No charge.
You are buying a resale, so the seller's side pays the co-broke and representation costs you nothing. The spread between $467 and $547 a foot in the table above is what I argue from.
Property Management Brickell LLC can run the unit. The lease record here is annual rather than nightly, so that is what I would underwrite, and I will get you the declaration's actual rental language before you commit to either.
Or go direct: WhatsApp · steve@bluebaybrokers.com · 786-622-6285